
THANKS, BIG GOVERNMENT!
We’ve written previously on the fundamental math associated with the American economic “recovery.”
In case you’ve forgotten, it went a little something like this …
Great Recession = Great Depression.
Now there’s a chart laying bare the extent to which the era of obscenely big government has adversely impacted our nation’s economic output …
(Click to view)
(Via: Roosevelt Institute)
Ah, “stimulus …”
That jarring graphic comes courtesy of a new report (.pdf) from the left-leaning Roosevelt Institute entitled “What Recovery?”
Here are its three most devastating takeaways …
1. The Great Recession was unprecedented in terms of severity of its impact and duration of that impact for any period since 1947.
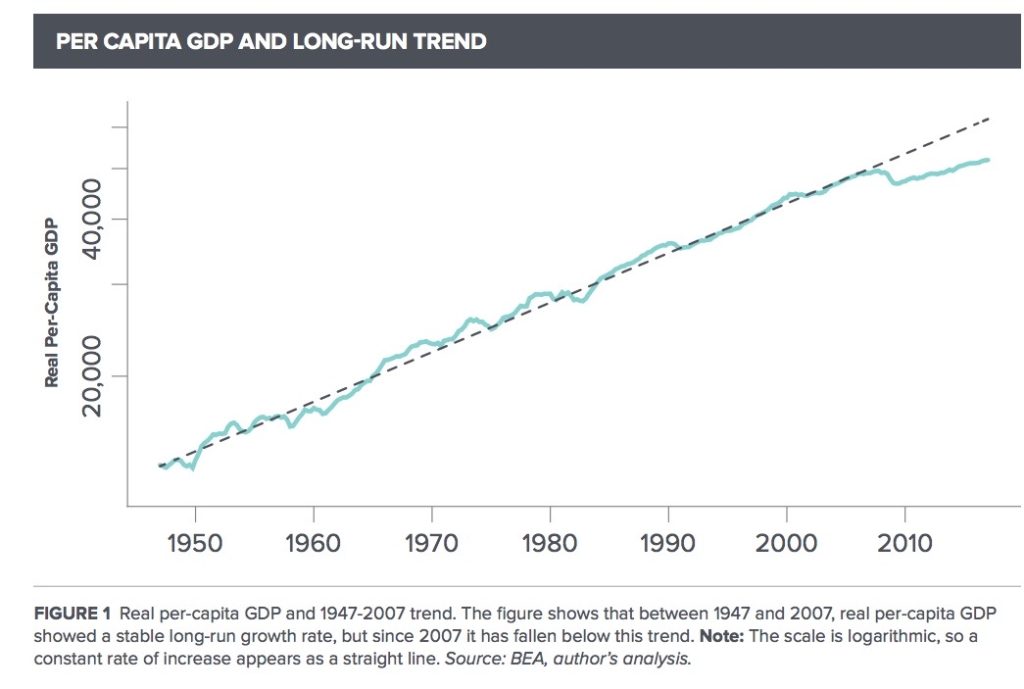
2. The Great Recession is the only period in the U.S. modern history when the long term (trend) path of real GDP per capita shifted permanently below historical trend.
3. The Great Recession is the only period in the U.S. modern history when the long term trend growth in GDP per capita substantially and permanently fell below historical trend.
“Output remains a full 15 percent below the pre-2007 trend line, a gap that is getting wider, not narrower, over time,” the report concluded.
Sadly, the Roosevelt report views the data as evidence for further government stimulation/ manipulation of the economy – a premise this website emphatically rejects.
We believe the ongoing economic “malaise” is precisely because of excessive government intervention, not in spite of it … as the data clearly bear out.
In fact we predicted this eight-and-a-half years ago when then-president Barack Obama‘s so-called “stimulus” was passed by the U.S. Congress.
“It is, quite simply, the worst possible response to our current economic crisis that America could have come up with – making its taxpayers fund an unprecedented bailout of failed bureaucracies at every level of government with money we don’t have,” we wrote back in January of 2009.
We added that Obama’s bill was “nothing more than pouring of hundreds of billions of dollars into the same old government sinkholes.”
Were we right? Um … yes.
Putting the political blame game aside for the moment, though, economist Constantin Gurdgiev referred to the Roosevelt Institute chart as “the most important chart I have seen in some months now.”
“On the net, the effects of the Great Recession in terms of potential output, actual output growth trends, labor productivity and wages appear to be permanent in nature,” Gurdgiev wrote on his True Economics blog. “In other words, the New Normal of post-2007 ‘recovery’ implies permanently lower output and income.”
***
WANNA SOUND OFF?
Got something you’d like to say in response to one of our stories? In addition to our always lively comments section (below), please feel free to submit your own guest column or letter to the editor via-email HERE or via our tip-line HERE …
Banner via iStock