SCARY NUMBERS …
Last month our friend Richard Manning of Americans for Limited Government (GetLiberty.org) published a guest post on Fox News praising U.S. president Donald Trump’s proposed federal budget.
“Our nation must get our fiscal house in order now, or else we may never have another opportunity, and President Trump has provided a pathway to bring our nation back from the brink of insolvency,” Manning wrote.
In support of its underlying premise, Manning’s piece contained the following excerpt …
The hard fact is that the past decade’s $10 trillion in deficit spending has produced the worst economic growth as measured by Gross Domestic Product in our nation’s history. You read that right, in the past decade our nation’s economy grew slower than even during the Great Depression. This stagnant, new normal, low-growth economy is leaving millions of working age people behind who have given up even trying to participate, and has led to a malaise where many doubt that the American dream is attainable.
Wait … what?
We knew things were bad, but they’re not that bad, are they? “Recession” is still better than “Depression” right?
Surely this is just political spin. More “fake news.” Another partisan going “all in.”
That’s what Michael Snyder of The Economic Collapse thought.
“When I first read that, I thought that this claim could not possibly be true,” Snyder wrote. “But I was curious, and so I looked up the numbers for myself. What I found was absolutely astounding.”
One of our favorite websites, The Economic Collapse is adept at cutting through political spin and breaking down the raw numbers.
So … do those numbers affirm Manning’s claim? Yes.
Using historical gross domestic product (GDP) data, Snyder tracked growth rates for every year during the 1930s …
1930: -8.5 percent
1931: -6.4 percent
1932: -12.9 percent
1933: -1.3 percent
1934: 10.8 percent
1935: 8.9 percent
1936: 12.9 percent
1937: 5.1 percent
1938: -3.3 percent
1939: 8.0 percent
Then he tracked growth rates for the last ten years …
2007: 1.8 percent
2008: -0.3 percent
2009: -2.8 percent
2010: 2.5 percent
2011: 1.6 percent
2012: 2.2 percent
2013: 1.7 percent
2014: 2.4 percent
2015: 2.6 percent
2016: 1.6 percent
Amazingly, the average annual economic growth for both of these ten-year periods was identical: 1.33 percent.
“I thought that was a really strange coincidence, and so I pulled up my calculator and ran all of the numbers again and I got the exact same results,” Snyder wrote.
Crazy, huh?
Obviously the 1930s data contained higher peaks and deeper valleys, but at the end of the ten-year comparison period the average annual growth rate remained the same.
“When you take an honest look at the numbers, there is no way that anyone can possibly claim that the U.S. economy is doing well,” Snyder concluded. “The best that you can say is that we have been staving off a complete economic meltdown and another Great Depression, but of course the measures that our leaders have been taking to do this have just been making our long-term problems even worse.”
That’s true …
“I feel bad for President Trump, because he has inherited the biggest economic mess in U.S. history,” Snyder added. “When we finally reach the point when it is impossible to artificially prop up the U.S. economy any longer, he is going to get most of the blame, but he won’t deserve it.”
Who does? This guy. And this guy. Oh, and these guys.
***
WANNA SOUND OFF?
Got something you’d like to say in response to one of our stories? In addition to our always lively comments section (below), please feel free to submit your own guest column or letter to the editor via-email HERE or via our tip-line HERE …
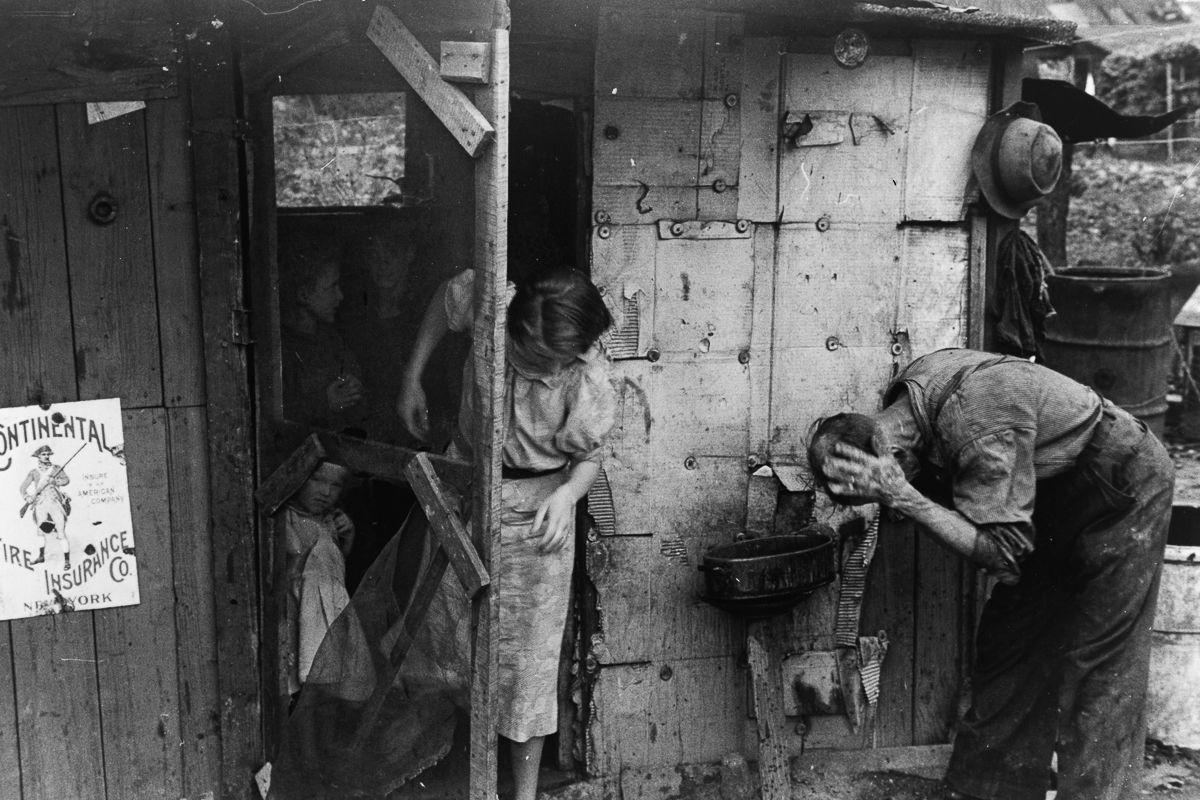
Banner via Ben Shahn/ Library of Congress